
Documentation
Documentation
This feature enables architects and designers to visualise the effects of light on and in their designs. It can be used to simulate the impact of heat caused by the sun's interaction with a building, or to identify dark spots within a proposed design.
Lighting Analysis is enabled and controlled from the Analysis tab, which can be accessed by selecting Rendering > Render Setup… from the 3ds Max menu bar. Settings on this tab affect both Production Rendering Mode and ActiveShade renders. If you wish to view the Additional Lighting Elements (see below) then consider using the Iray+ Frame Buffer.
Use the controls on the Lighting Analysis rollout to specify and configure the behavior of Lighting Analysis:
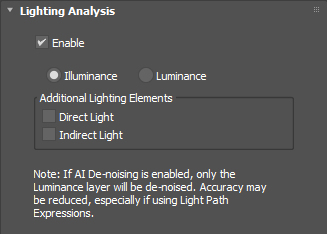
Enable: toggles Lighting Analysis on or off. Two modes are supported.
Additional Lighting Elements: lets you specify additional Render Elements, which can be displayed in the Iray+ Frame Buffer and which will be saved out in Production Rendering Mode.
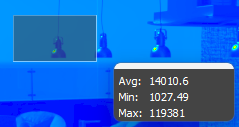
Real-time labels let you view lighting information at a point or within an area on the Frame Buffer.
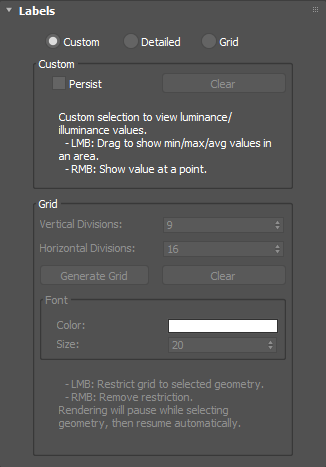
Three modes are supported.
 |
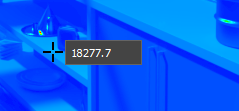 |
| Left mouse button: click and drag to view average, minimum, and maximum values in the selected area. | Right mouse button: click to view a value at a single point. Hold down the button while dragging to update the value for each new pixel that you visit. |
 |
Hold down the Right mouse button while dragging to update the data shown for each new pixel that you visit. |
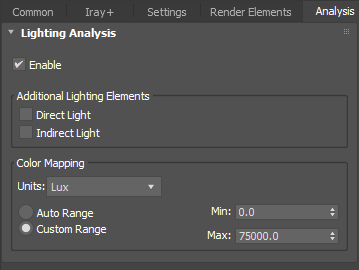
When Illuminance is enabled on the Lighting Analysis rollout, use the controls on the Illuminance rollout to specify how illuminance should be mapped to false color:
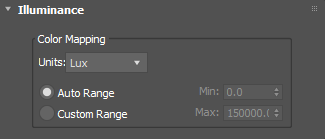
Color Mapping: controls the mapping of illuminance values in the scene to the false color display and the scale of the color chart.
When Luminance is enabled on the Lighting Analysis rollout, use the controls on the Luminance rollout to specify how luminance should be mapped to false color:
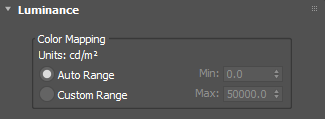
Color Mapping: controls the mapping of luminance values in the scene to the false color display and the scale of the color chart.
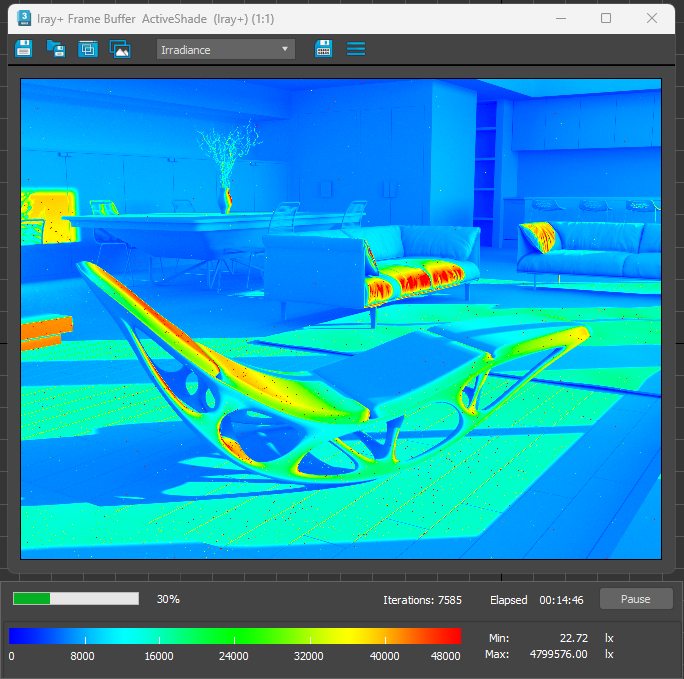
When using the Iray+ Frame Buffer (under either Production Rendering Mode or ActiveShade Mode), an additional toolbar will be displayed below the window when performing lighting analysis:

This toolbar displays a color chart showing how the false color scale maps to either the Auto or Custom illuminance/luminance range, as well as the absolute minimum and maximum illuminance/luminance values in the view. When using the default 3ds Max frame buffer, a similar toolbar is displayed for the ActiveShade Mode window, but not for the Production Rendering Mode window.
▲Last edited: